Fill Out This Form To Get Your Free Info Kit and Take Control of Your Education

By submitting this form, you have read and agree to our Privacy Policy.

Visions is now taking applications for Fall 26/27. Apply Today!

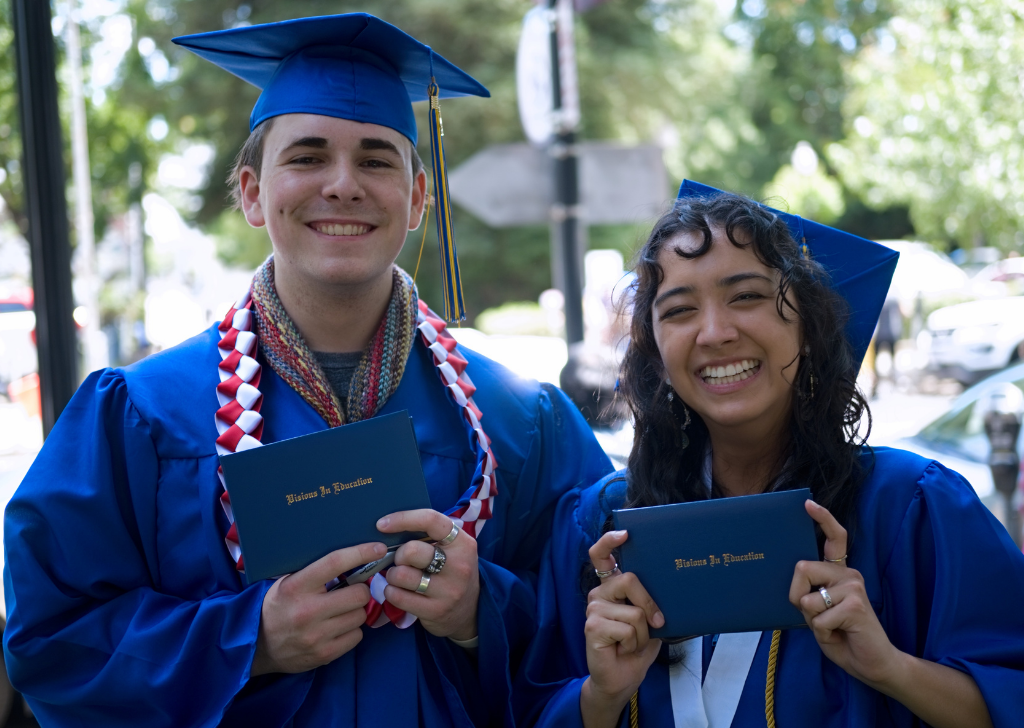
Visions graduates smiling and holding up their diplomas

Our Students, Our Results

1% Better Reports

At Visions, our staff and teachers are committed to improving a little every day for the students we serve. This commitment—our 1% Better mindset—has been the foundation of our work and our success for more than 25 years.

Each year, we highlight the wins (big and small) our organization has made to remind us of how far we’ve come and encouraging us to go even further. See the articles in the dropdown above for some of the incredible things our school has accomplished each year. 

Year in Review (Presentation) by Visions In Education

Visions in Education closed the 2025-26 school year with record growth. The school opened with 7,769 students on day one and reached a peak enrollment of 8,021 students, its third consecutive year of record enrollment, while maintaining a waitlist of more than 1,000 students for most of the year. Visions is working toward a goal of serving 10,000 students by 2030 and is preparing to expand its service area with a new school planned in Stanislaus County. To support this growth, the school is hiring 95 new teachers and support staff, the largest single-year staffing expansion in Visions' history. Student life has also grown significantly, now offering more than 100 clubs and dozens of events, alongside expanded tutoring, transportation support, and mentorship programs such as Bridge to College for first-generation students. Visions increased support for special education students and multilingual learners this year and added staff including psychologists and social workers. The school also invested in technology upgrades, including improvements to its LPAD platform and a new chatbot, and opened a new administrative office to support its growing team.

Annual Reports

In the spirit of continuous improvement, Visions puts out a yearly report each January to highlight the previous school year. While this report highlights major celebrations, it is also a deep dive into the school’s makeup and contains several other key data points that represent the overall stat of the school. 

See our annual reports below, including a comprehensive 25th Anniversary Impact Report that highlights our first 25 years. 

2024-2025 Annual Report

Annual Report by Visions In Education

2024-2025 Annual Report Highlights

Visions in Education marked its 25th year in the 2024-2025 school year with growth across enrollment, graduation, and community impact. Superintendent/Executive Director Steve Olmos, Ed.D., highlighted the school's move to a new facility after nearly two years of work, as well as expanded engagement with the legislative process to educate lawmakers on charter school management.

Enrollment

Visions in Education opened the 2024-2025 school year with 7,454 students on day one, distributed across four academies: 3,812 in Home School (TK-8), 193 in Online Middle School (7-8), 2,861 in Independent Study (9-12), and 588 in University Prep (9-12).

Student Population

Visions in Education served students across nine California counties in 2024-2025, including 3,319 in Sacramento County, 1,245 in Contra Costa County, 1,024 in San Joaquin County, 934 in Solano County, 423 in Placer County, 168 in El Dorado County, 151 in Yolo County, 134 in Amador County, and 62 in Sutter County. The student body was 40% White, 31% Hispanic, 10% two or more races, 9% Black or African American, 5% Asian, and 5% other. Special program populations included 56% economically disadvantaged students, 16% special education students, 8% English learners, and 3% foster or homeless youth.

Graduation

Visions in Education celebrated its largest graduating class ever in 2025, with more than 1,500 students graduating and more than 800 participating in ceremonies. The school expanded to four graduation ceremonies, held in February, June, and August, to accommodate the growing class. The graduation rate reached 84.2%, an increase of 2.4% from 2023-2024. Graduates from the Class of 2025 went on to universities including Baylor and Duke, entered apprenticeship programs, and joined the armed forces.

Academic Results

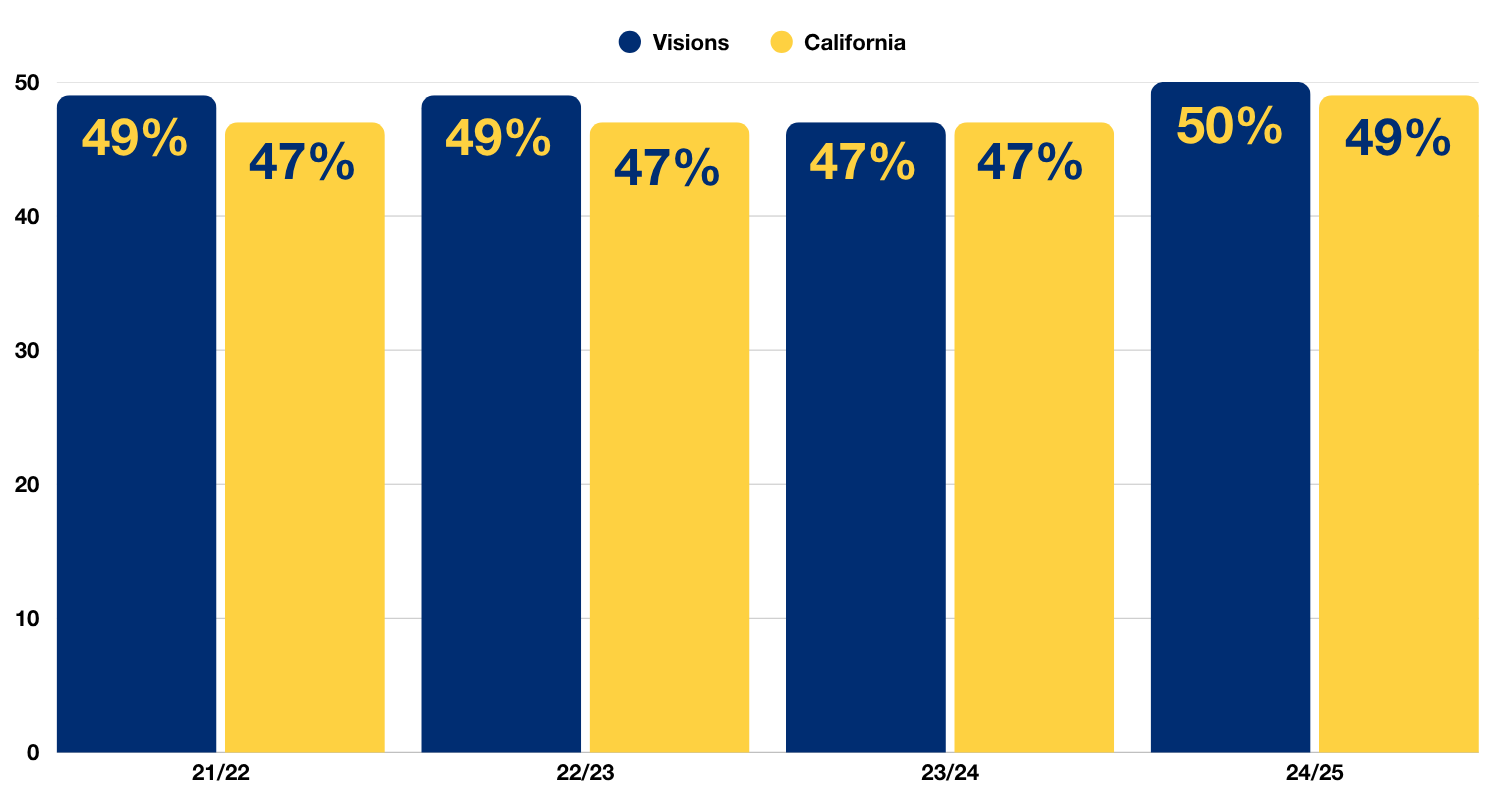
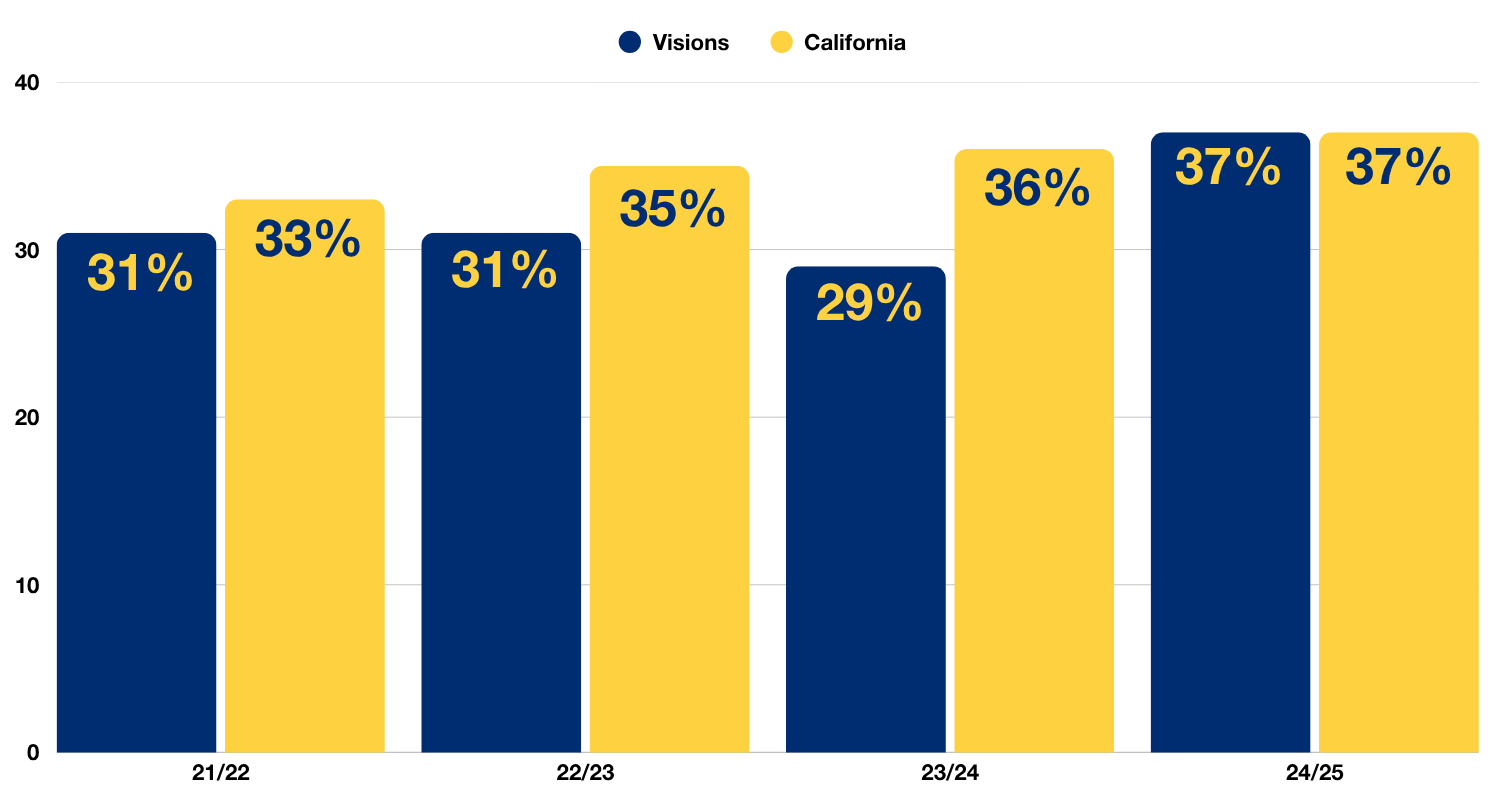
On the 2024-2025 CAASPP, 50% of Visions in Education students met or exceeded proficiency standards in English Language Arts, compared to the California state average of 49%. In Math, 37% of Visions students met or exceeded proficiency standards, matching the California state average of 37%.

Budget

Visions in Education operated on a $102 million budget in 2024-2025, including $40.5 million in certificated salaries, $23 million in employee benefits, $10 million in classified salaries, $17 million in services, $8.5 million in books and supplies, and $3 million in capital outlay. The school employed 362 teachers and instructional support staff, 101 administrative support staff, 34 instruction managers, and 16 business service managers. Visions returned a clean financial audit for the eighth consecutive year.

Community Impact

Visions in Education hosted two legislative open houses in 2024-2025 to inform lawmakers about charter schools, launched a classified staff mentorship program in partnership with Easley Done & Co, sponsored Street Soccer USA's 4th Anniversary Cup, and donated 1,000 Chromebooks to four YMCA locations to support families affected by wildfires.
CAASPP Results

At Visions, we use local and state test results to make sure each student is on track to succeed. While these results aren’t the only measure of student success, they’re a strong indicator of student progress and we pride ourselves in creating a supportive testing environment where each student feels ready to do their best. 

Thanks to daily guidance from our teachers, supported standards-aligned curriculum, and a positive testing culture, our students have made consistent improvements over the past few years. Students in historically underserved groups like African American and Hispanic students are also making gains at or above the state average. 

See the charts below for a snapshot of how our students are performing as a school as well as results for historically underserved student groups.  

English Language Arts (ELA) CAASPP Results

% of students that met or exceeded State Standards

Bar graph of ELA CAASPP scores
Visions in Education students met or exceeded ELA state standards on the CAASPP at 49% in 21/22, 49% in 22/23, 47% in 23/24, and 50% in 24/25, consistently on par with or slightly above the California statewide average, which was 47% in 21/22, 47% in 22/23, 47% in 23/24, and 49% in 24/25.

(Click the toggles below to see results for student groups)

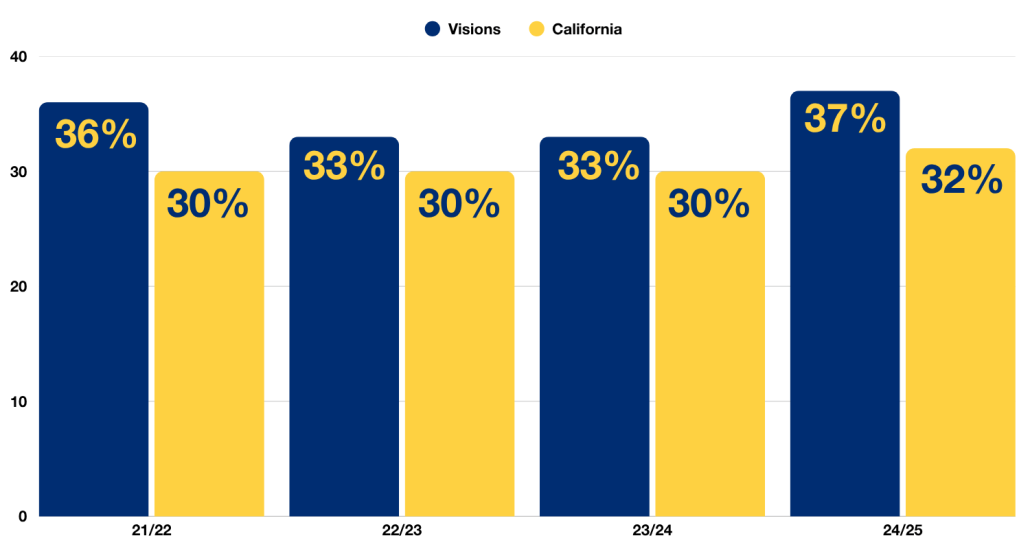
African American Student ELA Results

Bar chart of Visions vs. California African American student ELA CAASPP results, 2021/22 to 2024/25
In 2024/25, 37% of Visions in Education's African American students met or exceeded ELA state standards on the CAASPP, compared to the California state average of 32% for African American students.

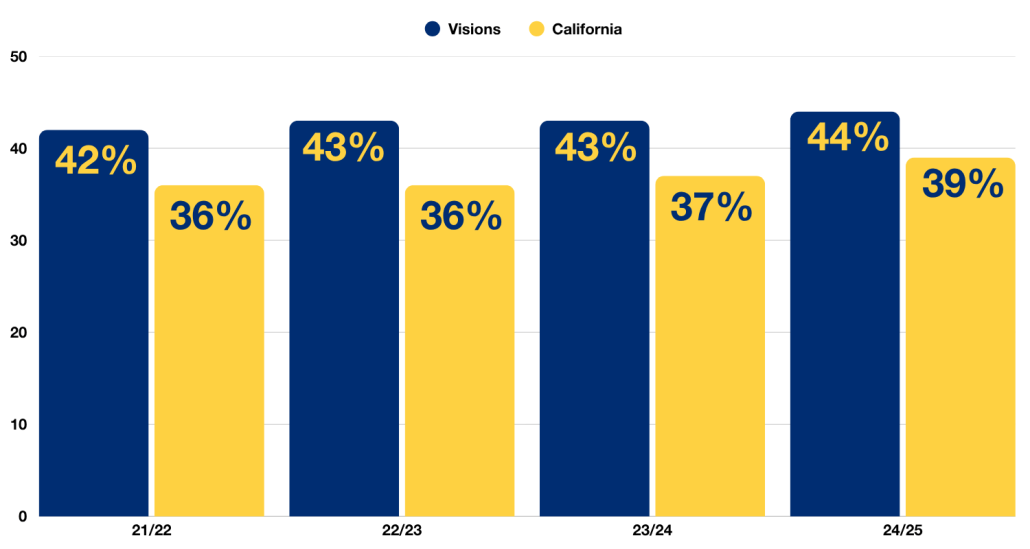
Hispanic Student ELA Results

Bar chart of Visions vs. California Hispanic student ELA CAASPP results, 2021/22 to 2024/25
In 2024/25, 44% of Visions in Education's Hispanic students met or exceeded ELA state standards on the CAASPP, compared to the California state average of 39% for Hispanic students.

Math CAASPP Results

% of students that met or exceeded State Standards

Bar graph of Math CAASPP scores
In 2024/25, 37% of Visions in Education students met or exceeded Math state standards on the CAASPP, matching the California state average of 37%.

(Click the toggles below to see results for student groups)

African American Student Math Results

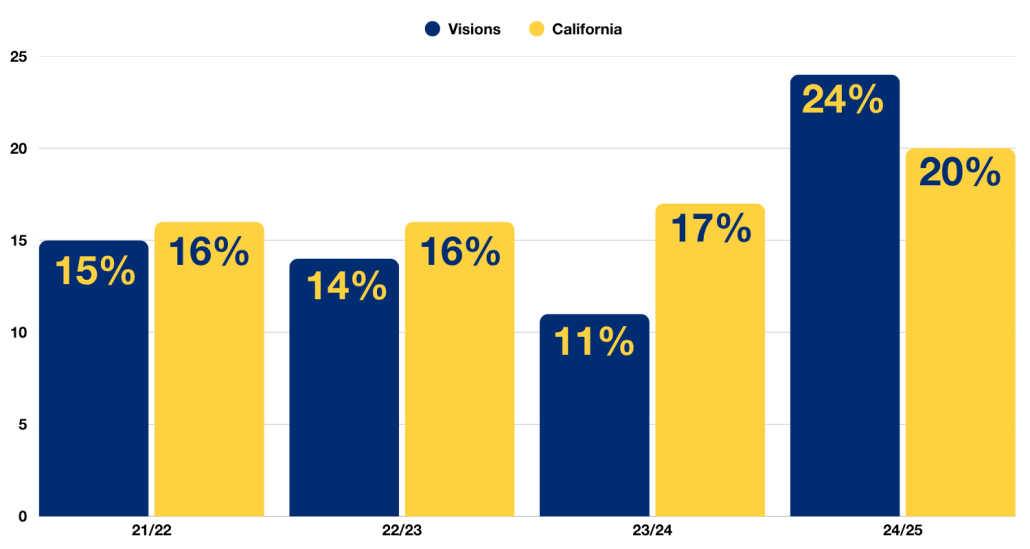
Bar chart of Visions vs. California African American student Math CAASPP results, 2021/22 to 2024/25
In 2024/25, 24% of Visions in Education's African American students met or exceeded Math state standards on the CAASPP, above the California state average of 20% for African American students

Hispanic Student Math Results

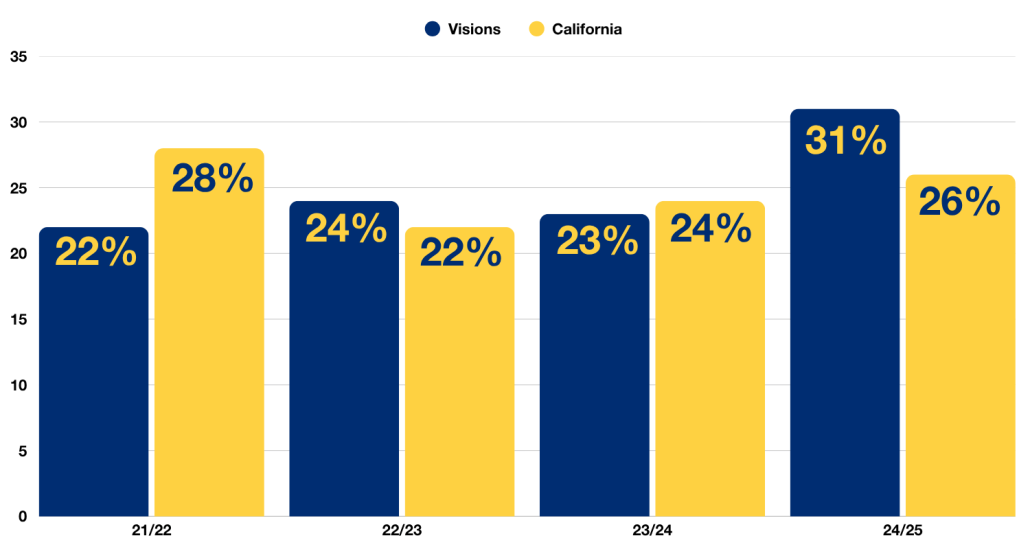
Bar chart of Visions vs. California Hispanic student Math CAASPP results, 2021/22 to 2024/25
"In 2024/25, 31% of Visions in Education's Hispanic students met or exceeded Math state standards on the CAASPP, above the California state average of 26% for Hispanic students.