Data-Driven Success: Visions 2025 California School Dashboard
The California Department of Education recently released the 2025 California School Dashboard, and we’re proud to share that this is Visions In Education’s strongest dashboard performance yet!
The California School Dashboard helps families understand how schools and districts across the state are serving students. It brings together important information, including state test scores, attendance, graduation rates, English Learner progress, college and career readiness, and more, to give a full picture of student advancement and school performance.
Our Best Dashboard Yet
At Visions, our mission is to prepare every student to succeed in a rapidly changing world. A key part of that mission is helping students meet grade-level learning standards so they are ready for life after high school. As performance data is reviewed, we invite you to consider the diverse student populations we proudly serve. Many face unique challenges, which may shape how traditional test scores and state measures reflect their progress.
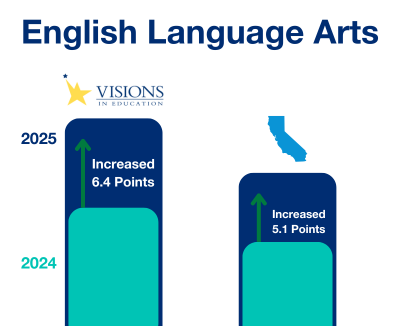
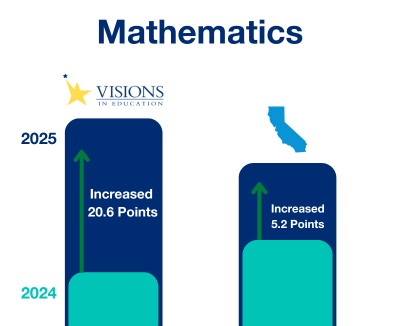
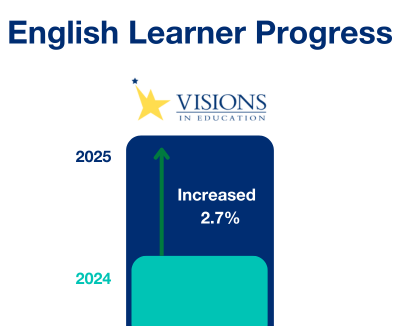
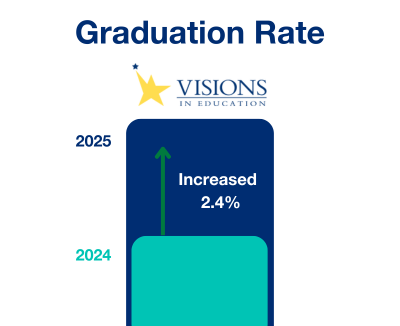
This year’s results show meaningful gains across core areas. In English Language Arts, Visions students increased 6.4 points toward the learning standard, outperforming the state average by 1.3 points. Visions students outperformed the state in Mathematics as well, increasing 20.6 points toward the learning standard. Students learning English made a 2.7% increase in language development. We are also proud to celebrate our second highest graduation rate in Visions history, at 84.2%.
These achievements reflect the dedication of our students, the support of their families, and the commitment of our staff. Special thank you to our Instruction, Student Services, Internal Data and System Services, and Assessments departments for the collaborative work that makes this progress possible.
Continued Commitment to Progress
While we celebrate these milestones, the Dashboard also gives us valuable information to guide our next steps. Our goal is not just strong performance now, but continuing to get 1% Better each day. We will continue to review and use this data to strengthen instruction, refine our programs, and ensure we are meeting the unique needs of every student.